Better decisions and improved operational efficiency with Metrics API
In the fast-paced environment of public transportation, where operational efficiency directly impacts passenger satisfaction and safety, the ability to quickly respond to and resolve technical issues is paramount. Train operators often encounter challenges within their support and maintenance teams due to the absence of comprehensive, immediate data from their edge networking devices. This lack of detailed information complicates routine troubleshooting, extends resolution times, and impacts overall service quality, affecting not only day-to-day operations but also areas such as quality assurance, predictive maintenance, and compliance with service level agreements (SLAs).
Enter the Unwired Metrics API: a transformative solution designed specifically to empower operators with detailed, queryable, and visualized data from their edge networking devices. By providing a wealth of metrics in an easily accessible format, our API streamlines the support processes, enabling faster diagnosis and resolution of issues, ensuring that trains run smoothly, and passengers remain connected and satisfied.

Metrics API for Enhanced Edge Device Management in Rail Operations
In today’s data-driven world, the ability to quickly gather, analyze, and act upon information is not just an advantage; it’s a necessity — Recognizing this critical need, we are proud to introduce the Metrics API, the latest enhancement to Unwired Edge Cloud observability stack, designed to transform the way train operators manage and support edge networking devices.
The Unwired Metrics API is engineered to address the core challenges of support & quality assurance by providing an unprecedented level of visibility into the performance and health of edge networking devices. Based on the robust foundation of Prometheus and PromQL, the API delivers detailed, actionable insights that were previously either out of reach or hard to comprehend. With Metrics API, train operators can now access a wealth of data, enabling them to pinpoint issues with precision and expedite the resolution process.

Key features of the Metrics API include:
- Comprehensive Monitoring: The Metrics API provides a holistic view of your infrastructure, offering detailed metrics for devices, edge applications, and the orchestration runtime. This wide-ranging monitoring ensures that operators have all the necessary data to maintain optimal performance and reliability.
- Vast Data Access: Instantly query and visualize data through the Unwired Edge Cloud Console with an integrated Prometheus UI for intuitive analysis.
- Flexible Integration: Designed with versatility in mind, the Metrics API can be easily integrated into your existing monitoring and alerting systems, ensuring you can leverage the data where it’s needed most. The Metrics API supports integration with a wide range of tools and alerting systems, including but not limited to Prometheus, Grafana, Google Cloud, Azure Monitor, Nagios, and Zabbix.
- Actionable Insights: Beyond mere data collection, the Metrics API enables train operators to transform data into actionable insights, facilitating quick decision-making and issue resolution.
Real-World Impact: Unwired Metrics API Facilitates Swift Resolution for Train Connectivity
A telling example of the Metrics API’s capability comes from a recent incident involving one of our customers. Here’s how the Unwired Metrics API helped diagnose and resolve a sporadic connectivity issue that was affecting one of their trains.
Background: The train in question utilized CloudLink WAN Bonding, equipped with two modems linked to different providers. While this setup typically ensures continuous connectivity by merging several WAN connections based on signal strength to optimize both bandwidth and reliability, the train still faced intermittent connectivity issues. These were particularly noticeable in certain sections of the train track, often correlating with areas where only one provider’s signal was available, preventing the system from reaching its maximum bandwidth potential.
Challenge: The challenge was to determine why, despite active modem connections, the train’s internet speed was sporadically reduced, impacting operational efficiency and passenger service.
Diagnostic Process with the Unwired Metrics API:
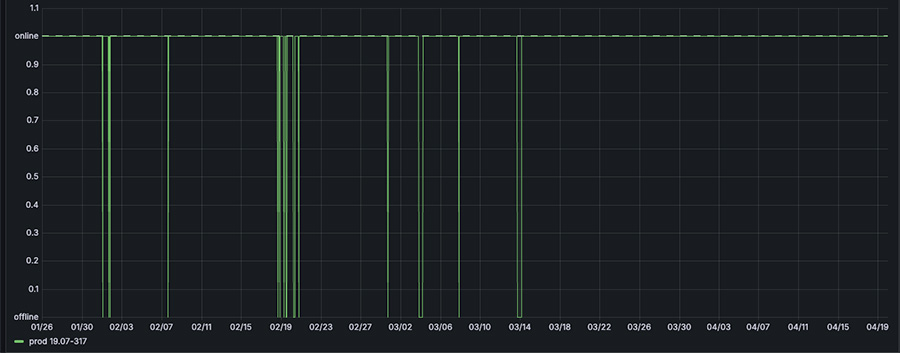
Initial Checks: Our Metrics API confirmed that both modems were consistently online, indicating that the issue wasn’t with the modems themselves.

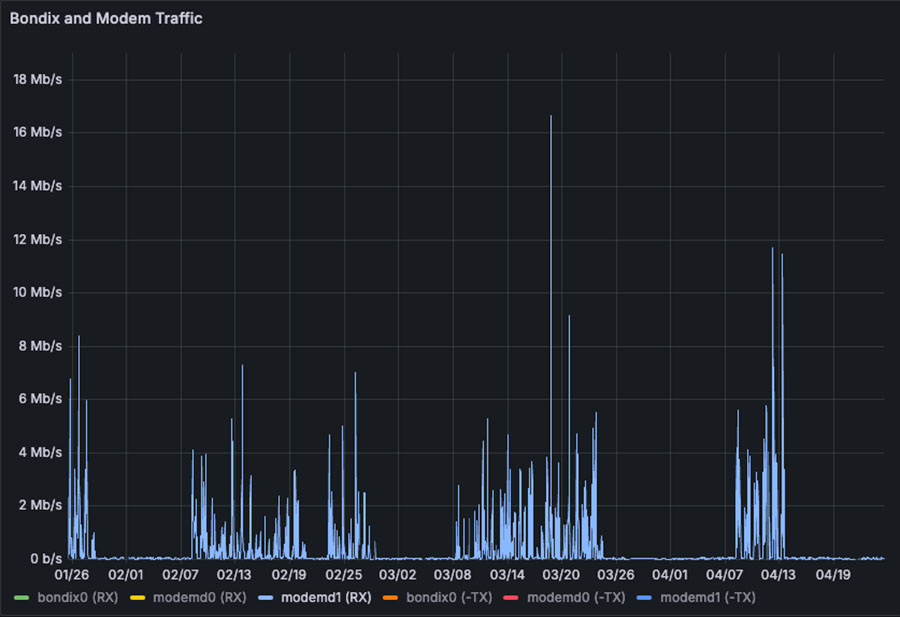
Deep Dive into Data Throughput: Further analysis focused on the individual modems’ throughput. It revealed a recurring pattern: Starting at different times each month, one modem’s bandwidth consistently dropped to a maximum of 64 kbit/s, initiating a pattern of reduced connectivity that persisted until the 8th of next month.

Identification of the Issue: This specific speed cap is indicative of a data limit being reached. Intriguingly, our customer had subscribed to an ‘unlimited’ data package, which should not have any such restrictions.
Resolution:
- Provider Error Addressed: It became evident that there was a misconfiguration or fault with the data plan from the provider. After the issue was raised by our customer, the provider corrected the fault, ensuring that the data plan reflected the ‘unlimited’ service that was paid for.
- Role of CloudLink: Fortunately, due to CloudLink WAN Bonding the secondary modem transparently mitigated the impact of the issue until it was resolved, demonstrating its value.
- Outcome: This incident illustrates the effectiveness of the Unwired Metrics API in not only identifying and diagnosing complex connectivity issues but also in helping to facilitate a rapid resolution. It underscores the importance of detailed, data-driven insights in managing modern transportation services.
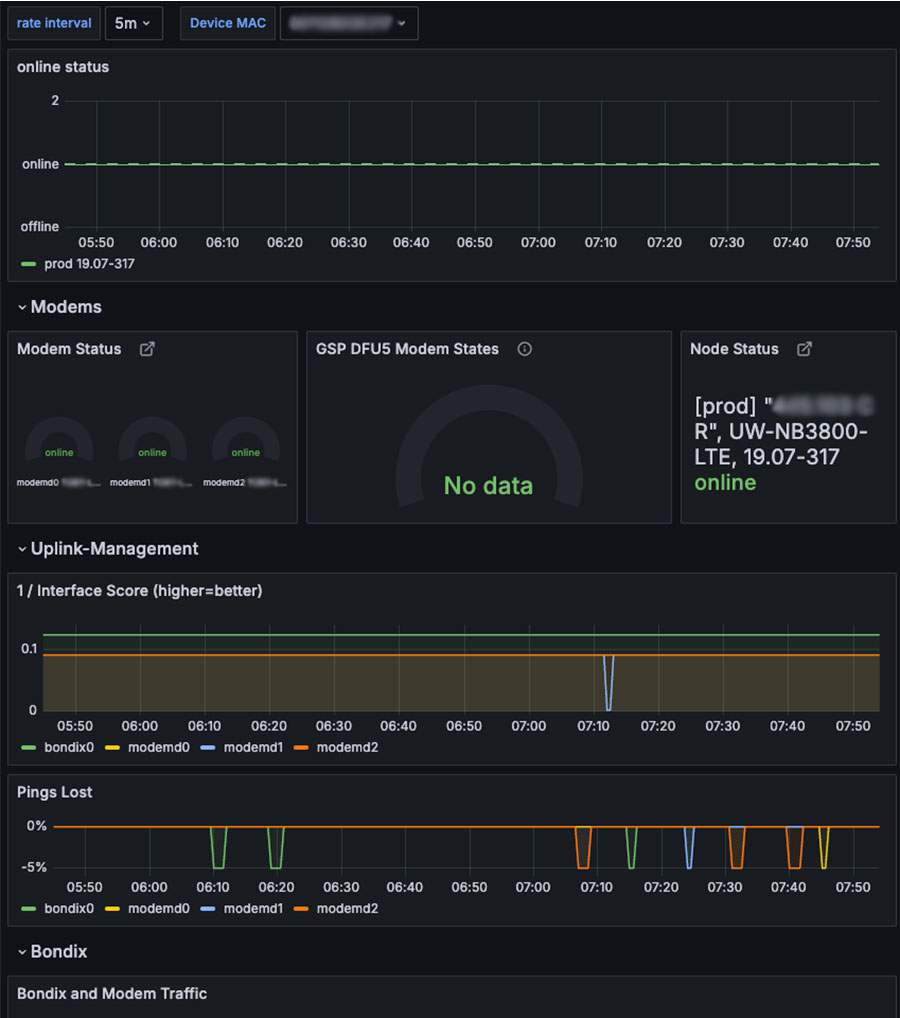
Proactive Monitoring with Grafana Cloud: In this real-world example, Grafana Cloud was the Ops tool of choice, offering an intuitive dashboard that provided a quick and comprehensive overview of the device in question. Next, we’ll demonstrate how simple it is to integrate our Metrics API with Grafana Cloud. This setup, which can be completed in just a few minutes, equips you with a robust monitoring and alerting tool, enhancing your operational capabilities and ensuring you stay ahead of potential issues.
Easy Setup with Grafana Cloud
For a seamless and cost-effective implementation of a new ops tool, we highly recommend Grafana Cloud. Here’s why it’s an excellent choice for our customers:
- Cost-Effective Solution: Grafana Cloud allows our customers to implement a comprehensive reporting dashboard and alerting setup at little to no cost.
- Pre-configured Dashboards: We provide a JSON file with a pre-configured dashboard tailored to the use cases most critical to our customers. Simply upload this file to your Grafana account, and you’re ready to go.
- Visual Alert Setup: Setting up alerts in Grafana is a straightforward, visual process that takes only seconds. Alerts can be customized to meet any specific need, ensuring you stay informed about critical metrics.
- Enhanced Observability: By integrating our Metrics API with Grafana, you equip yourself with a powerful ops tool that offers unparalleled observability of your Unwired Edge Cloud devices—achieving great functionality with minimal setup effort.
Need a Custom Dashboard or Help Setting It Up?
If you’re looking to create your own dashboard and alerts or need some guidance with setup, don’t hesitate to get in touch. We’re always here to help you optimize your operations with the Unwired Metrics API.

Expanding Capabilities and Next Steps
The Metrics API is not only a powerful tool for diagnosing and resolving connectivity issues but also offers a broad array of metrics to enhance your operational insights. Current metrics include bandwidth usage, latency measurements, device status, and much more, with new metrics being added regularly to enhance your analytical capabilities.
For a more detailed exploration of all the features and metrics available through the Metrics API, please visit our documentation page.
If you’re looking to improve your transportation services’ efficiency and reliability, don’t hesitate to reach out. Contact our sales team today to learn more about how the Metrics API can transform your operations and help you deliver a superior service experience. Your journey towards smarter, data-driven decision-making starts here.


